
Le Comptoir de Sévigné
Business dashboard
Demonstration project — not commissioned by a client. Built to illustrate a capability or an approach.
View the live site ↗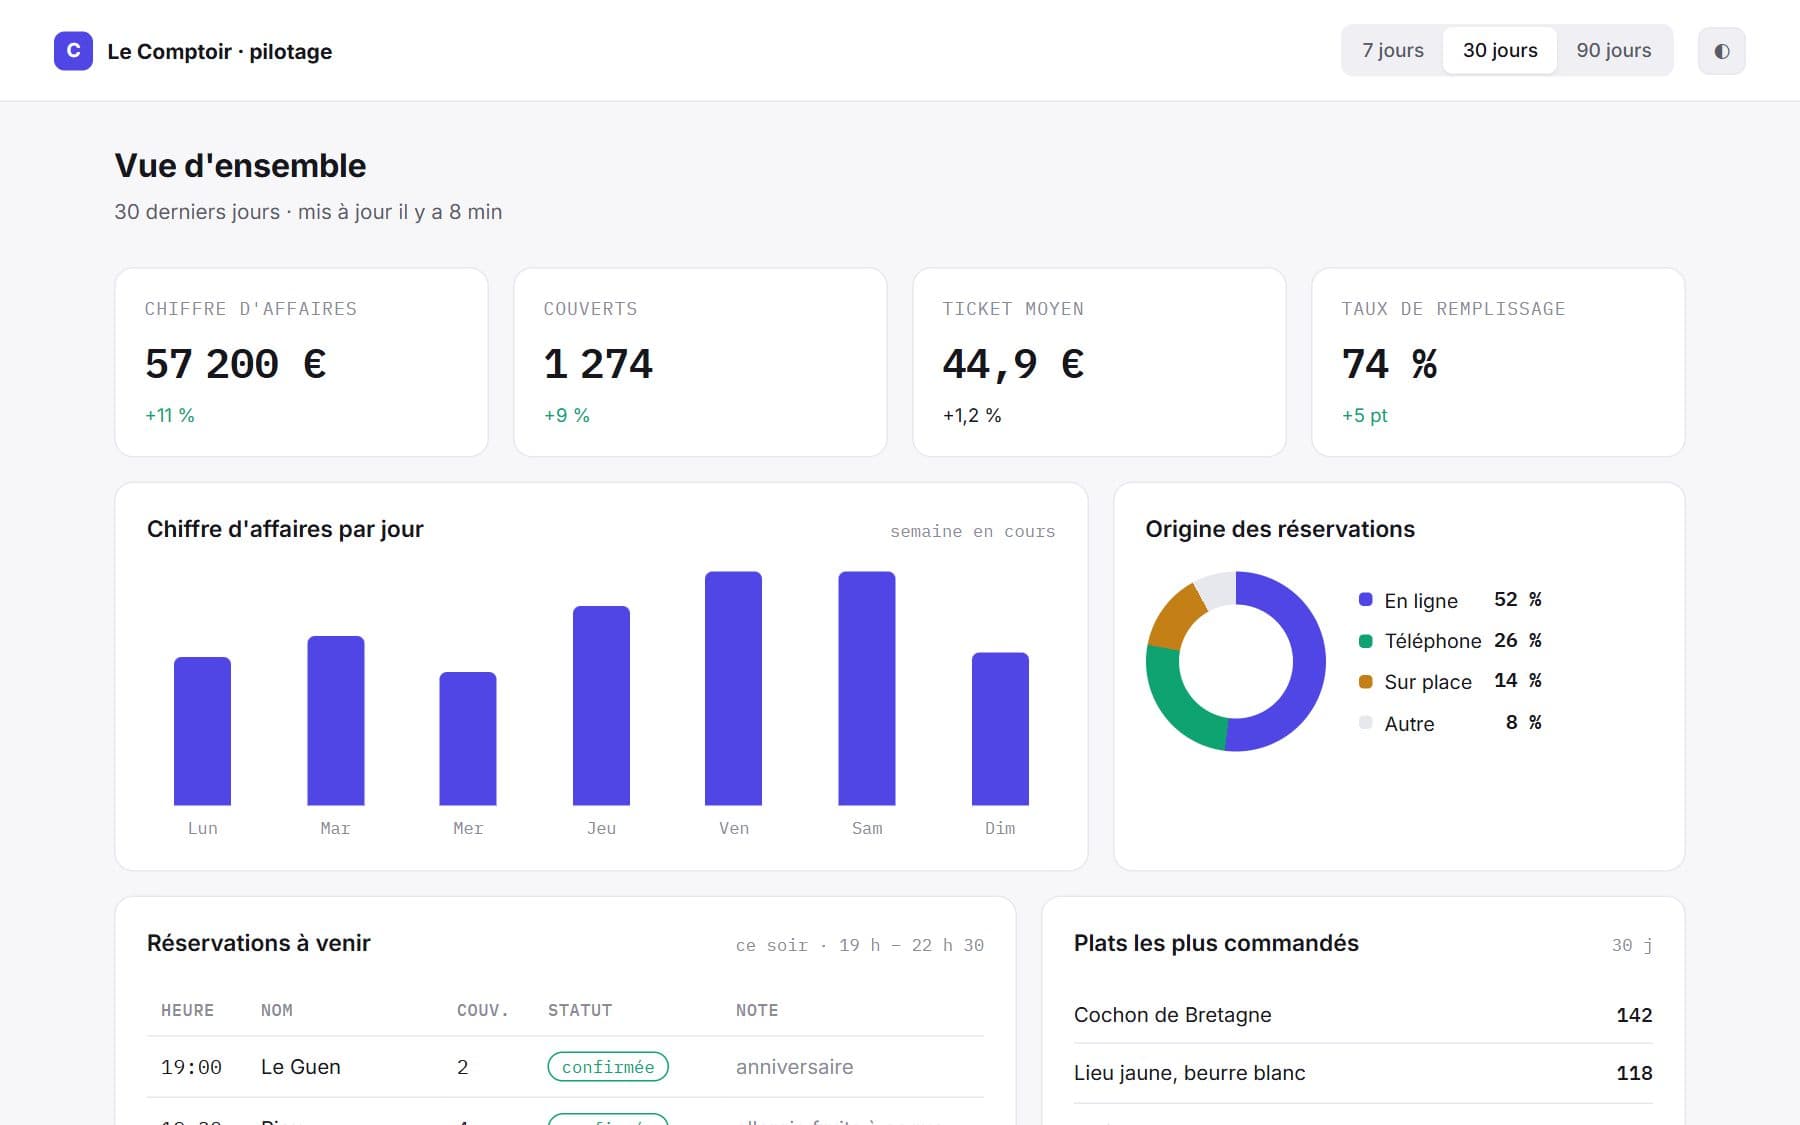
- Sector
- Demo · App & data
- Year
- 2026
- Stack
- HTML · CSS
The need
A brief I set myself: a restaurateur does not need a spreadsheet, they need three correct, legible figures over morning coffee. What a well-made internal tool looks like.
What I did
A preview of a clear pilot tool: four indicators (revenue, covers, average ticket, occupancy) with deltas and animated counters, a period switcher (7 / 30 / 90 days) that recomputes everything, a revenue bar chart with tooltips, a reservation-source donut, an upcoming-reservations table with statuses, a dish ranking. Light interface, one accent colour, tabular figures.
The outcome
Shows the “data app” side: hand-built charts (SVG / CSS, no dependency), instant reading, information hierarchy. Would connect to the till and the booking module.